
Prerequisites:
The Content Analytics section will be accessible to users only if all the following conditions are met:
-
The feature flag is enabled in your Admin Portal. To learn more, see List of Apty Feature Flags.
-
Segments for your Apty Content are created and in active state. To learn more, see What is a Segment and how is it helpful?
-
Users are identified using either the Application ID or the Custom ID. To learn more, see Unique User Identification (Version 4.x and above).
With the use of a range of custom filters, Content Analytics gives you a better insight into how various Apty Content is operating on your application, enabling you to make smarter business decisions.
Every section in the global dashboard displays the following important factors:
-
The type of engagement with your Apty Content.
-
Statistics and numbers indicating the frequency of user engagement with your Apty Content.
-
The rate of engagement that has changed from the previous to the selected duration.
| Percentage Type | Description |
 |
The upward green arrow signifies a 100% rise in the Announcements engagement rate and the downward red arrow indicates a 50% drop in the number of users engaging with the Announcements for the chosen month compared to the previous month. Similarly, for quarterly or yearly duration, Apty will display data compared to the previous quarter or year. |

To view the Content Analytics global dashboard,
-
Login to your Admin Portal.
-
Select your Application from the left panel and then click
Content Analytics to navigate to the Workflows dashboard.

You can use the following options to filter the data you want to display in the global dashboard:
-
Duration- Displays the Workflows available for the selected period.
-
Environment- Displays the Workflows available for the selected Environment.
-
Segments- Displays the Workflows available for the selected Segments.

Info:
-
The data in the dashboard will be refreshed every ninety minutes.
-
By default, the time zone is set to your browser's local time. This displays your Apty Content based on your local time zone.
-
You can click the vertical ellipsis and then select Customize Dashboard to drag and drop a section to change the look and feel of the dashboard.
The global dashboard of Content Analytics displays the following data:
Content Overview
Each tab in this section displays the total number of user engagement with each Apty Content(Workflows, Validations, Tooltips, Launchers, Announcements, and Knowledge Center Content) on your application as well as the change in the engagement rate between the previous and the current period. You can click each tab to navigate to the corresponding analytics dashboard which displays detailed analytics for every Content.
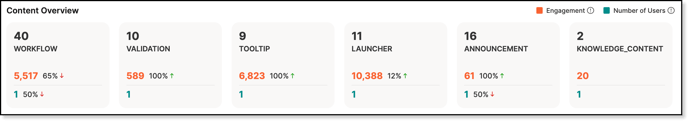
Each tab consists of the following elements:
-
The total number of the Apty Content created on your application for the selected duration. For instance, the image above shows that your application has 40 Workflows, 10 Validations, 9 Tooltips, and so on.
-
Total count of engagement with the Apty Content in the selected duration. For instance, Workflows have been engaged(Initiated, Completed, Inprogress, Incomplete, Error) 5,517 times in the selected duration.
-
The change in percentage of Apty Content engaged between the previous and the selected duration. For instance, there has been a 65% decline in Workflow engagement from the prior month to the present one.
-
Total number of users who engaged with the Apty Content.
-
The change in percentage of users between the previous and the selected duration, who have engaged with the Apty Content. For instance, there has been a 50% decline in the number of users who engaged with the Workflows from the prior month to the present one.
Content Engagement
You can hover your cursor over the appropriate progress bar in this section to view the count of the Engaged and Unengaged Apty Content on your application.
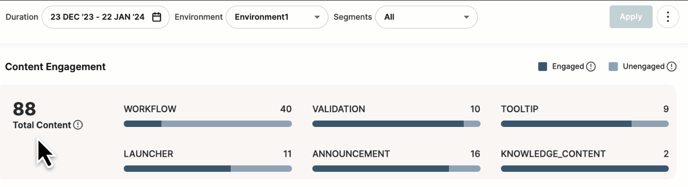
-
Engaged- Displays the count of Apty content that has been created and engaged(Initiated, Completed, Inprogress, Incomplete, Error) within the selected duration.
-
Unengaged- Displays the count of Apty Content that has been created but not engaged in the selected duration.
Trend Comparison
You can view and compare the Content Engagement count between the Durations selected in the Trend Comparison and the Global Filters section. For example, if you have selected Last 30 Days (24 DEC '23 - 23 JAN '24) as the Duration in the Global Filters section and Last 6 Months as the Duration in the Trend Comparison section, the latter will automatically update to 24 JUL '23 - 23 JAN '24. This enables you to view and compare the Engagement count between the two durations through the progress bars.
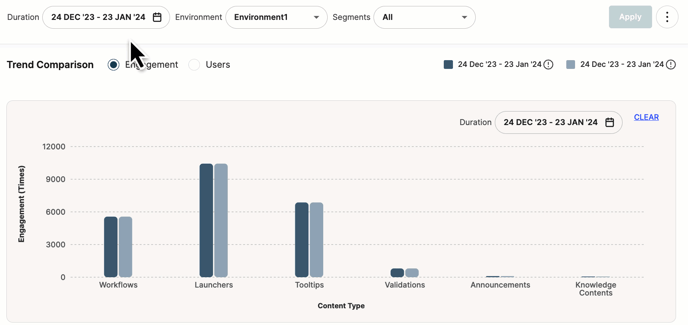
Similarly, you can compare the number of user engagements with Apty Content between both durations by selecting the Users radio button.
Overall Content Adaption
This section gives a total count of Apty Content that was created, published, and unpublished in your application for the selected duration.
You can click each Content tab to view the relevant data in the table below:
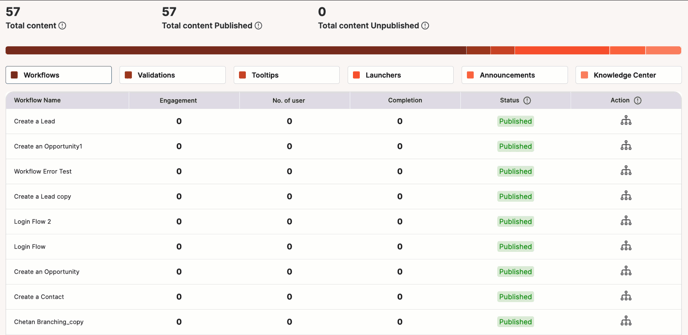
The Overall Content Adaption table consists of the following shared and unique data:
| Content Name | Workflows | Validations | Tooltips | Launchers | Announcements | Knowledge Center |
| Content specific data |
Completion: The count of Workflows that have been executed through the last step for the selected duration. |
Data Correction: Total no. of Validations that were failed during the selected period. |
Engagement rate: The change in percentage of user engagement for each Tooltip between the previous and the selected duration.
|
Accepted: The no. of users whos has accepted the Announcement for the selected duration. Announcement indicates that the user has read, understood, and agreed to content in the Announcement. Once the user accepts the Announcement, it will no longer show up on the application page. |
Content type:
|
|
| Shared data |
Engagement: Total count of engagement (Initiated, Completed, Inprogress, Incomplete, Error) with the Apty Content in the selected duration. |
|||||
|
No. of User: Total no. of unique users who engaged with the Apty Content. |
||||||
|
Status: The latest status (published or unpublished) of the Apty Content. |
||||||
Engagement Analysis by Segments
The three most and least number of engagements with your Apty Content are displayed in this section for the selected segment and duration. For example, if you've selected the segment as Region, the analysis table will provide the three most and least engaged countries with their user engagement metrics for each Apty Content.

|
Data Type |
Display Status |
|
Region |
Displays the name of the Segments with the three highest and three lowest engagements count in descending and ascending order respectively for the selected duration. For example, if you select the Segment Group as Region, it will display three countries that had the most number of engagements with each Content in descending order and three countries that had the least number of engagements in ascending order. Similarly, if you select the Segment Group as Department, it will display three departments in your organization that had the most number of engagements with each Content in descending order and three departments that had the least number of engagements in ascending order. |
|
Engagement |
|
|
No. of user |
|
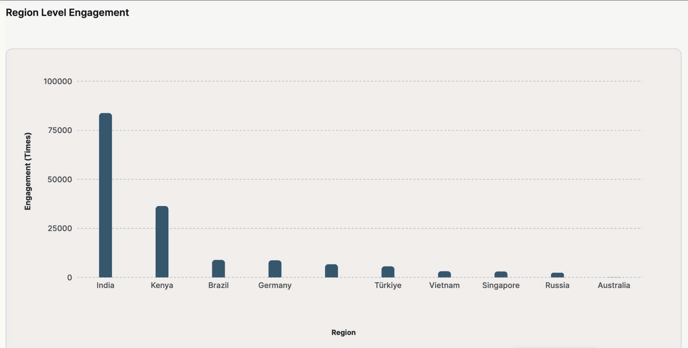
Region Level Engagement
This section provides consolidated statistics of user engagement with your Apty Content across various locations or demography. The information that appears while you hover your cursor over each progress bar is as follows:
-
Engagement - Displays the engagement count of each region with your Apty Content for the selected duration and the rate of change of engagement between the previous and the selected duration.
-
No. Of Users - Displays the total number of users in the respective region who engaged with the Apty Content for the selected duration and the rate of change of user engagement between the previous and the selected duration.
Device and Browser Level Engagement
This section provides user engagement with your Apty Content across various devices and browsers for the selected duration.
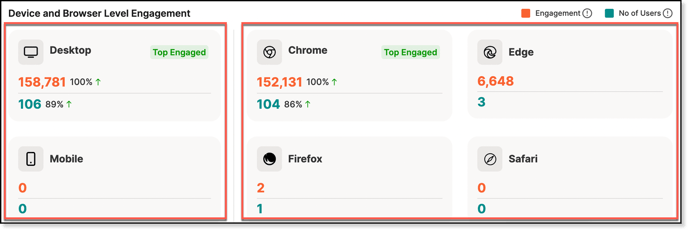
Device Level Engagement
Each tab displays the following information for Desktop and Mobile devices:
|
Data Type |
Description |
|
Engagement |
|
|
Users |
|
Browser Level Engagement
Each tab displays the following information for different browsers, including Chrome, Firefox, Edge, and Safari:
|
Data Type |
Description |
|
Engagement |
|
|
Users |
|
To view the statistics of each Apty Content in depth, refer to the following articles: