
To view the Launcher Analytics dashboard:
1. Login to your Admin Portal.
2. Select your Application from the left panel and then click Content Analytics.
Note:
The Content Analytics section will be accessible to users only if all the following conditions are met:
- The feature flag is enabled in your Admin Portal. To learn more, see List of Apty Feature Flags.
- Segments for your Apty Content are created and in active state. To learn more, see What is a Segment and how is it helpful?
- Users are identified using either the Application ID or the Custom ID. To learn more, see Unique User Identification (Version 4.x and above).
- See Overview of the Content Analytics Dashboard for a comprehensive understanding of the global dashboard.
3. Click the Launchers tab in the Content Overview section of the global dashboard.
4. Once you navigate to the Launcher Analytics dashboard, you can use the following options to filter the data you want to display in the dashboard:
- Duration- Displays the Launchers available for the selected period.
- Environment- Displays the Launchers available for the selected Environment.
- Segments- Displays the Launchers available for the selected Segments.

Info:
You can click the vertical ellipsis and then select Customize Dashboard to drag and drop a section to change the look and feel of the dashboard.
Dashboard Level Insights
This dashboard provides a comprehensive overview of metrics associated with the selected Content. It offers insights into overall engagement, adoption, usage, and completion rates for your Launchers across the application.
Launcher Engagement Analysis
This section shows the overall engagement that users have had with all the Launchers on your application, as well as the user engagement rate that has changed between the previous and the selected duration.
The definitions of each Launcher status are provided in the table below:
| Data Type | Display Status |
| Overall Engagement |
|
| Total Users |
|
| Displayed |
|
| Engagement Rate |
The percentage of times that the Launchers displayed information on hover or click for the selected duration. |
You can hover your cursor over the i icons to view the description for each status.
Launcher Engagement
This section consists of the top three Most Engaged and Least Engaged Launchers for the selected duration.
| Data Type | Display Status |
| Most Engaged Launchers |
|
| Least Engaged Launchers |
|
| Unengaged Launchers |
Three Launchers with zero engagement. |
You can hover your cursor over the i icons to view the description for each type.
Note:
You can click the View All button to view all the Launchers and their statuses.
Content Overview
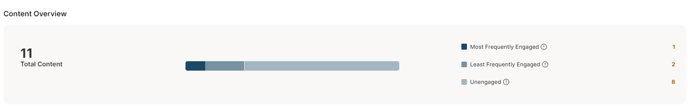
This section displays the frequency of engagement with the Launchers deduced from their mean engagement rate for the selected duration. Assume that your application has five distinct Launchers and that the count of engagements with each Launcher for a certain month is as follows:
| Launchers | No. of times the Launchers were engaged within a month | Mean (sum of engagements for the given duration/total no. of engaged Launchers) |
| Launcher 1 | 100 | (100+150+60+50)/4=360/4=90 |
| Launcher 2 | 150 | |
| Launcher 3 | 60 | |
| Launcher 4 | 50 |
Consequently, the Launchers that have the Engagement count higher than the Mean are considered to be the Most Frequently Engaged, while the Launchers with the Engagement count lower than equal to the Mean are considered to be the Least Frequently Engaged. Thus, the engagement order for the Launchers is as follows, starting from the Most Frequently Engaged to the Least Frequently Engaged:
Launcher 2> Launcher 1> 90> Launcher 3> Launcher 4.
You can hover your cursor over the i icons to view the description for each type.
Segment Level Insights
This section displays the metrics of all your Launcher engagements for the selected segment within the selected duration.

For example, you can see that the Finance Department includes 2 users engaged(hovered or clicked) with the Launchers 115 times and 4 users viewed the Launcher icons/buttons 208 times on the application for the selected duration.
Launcher Analysis
This section lists the top 5 Launchers in the increasing and decreasing order of user engagement rate for the selected duration. Each filter also displays the number of users engaged with each Launcher.
Content Level Insights
For more detailed analytics on each Launcher, users can access content level insights, that allow users to delve deeper into the performance of individual Launchers.
a. Click the View All button on the Launcher Engagement section in the primary dashboard.

The following data is shown in a maximized table for all the existing Launchers created within your application:
| Data Type | Display Status |
| Launcher Name | Name of the Launcher given by the Content Creator. |
| Engagement |
|
| No. of User |
|
| Displayed |
|
| Status | The Launcher status indicates whether it is Published, Not Published, or Deleted. |
Note:
You can add additional data to the table by clicking the gear icon and selecting the required filters.
b. Select a Launcher from the table to examine its usage in detail.

Launcher Engagement Analysis
This section shows the overall engagement that users have had with the selected Launcher on your application, as well as the user engagement rate that has changed between the previous and the selected duration.

The table below provides the definitions for each Launcher status:
| Data Type | Display Status |
| Overall Engagement |
|
| Total Users |
|
| Displayed |
|
| Engagement Rate |
The percentage of times that the Launcher displayed information on hover or click for the selected duration. |
You can hover your cursor over the i icons to view the description for each status.
Average Engagement Metrics

This section displays the average engagement count of the Launcher on a daily basis during the selected period. Consider the following situation, where a Launcher is engaged n times each day for a week:
| Duration |
No. of times the Launcher was engaged (n) |
Daily Average Engagement count (sum of engagement counts per day/total no. of days) |
| Day 1 | 100 | (100+200+300+90+80+50+40)/7 = 122 |
| Day 2 | 200 | |
| Day 3 | 300 | |
| Day 4 | 90 | |
| Day 5 | 80 | |
| Day 6 | 50 | |
| Day 7 | 40 |
Therefore, on average, the Launcher was engaged 122 times per day for one week.
Similarly, you can view the daily average count of users who engaged with the Launcher along with the daily average percentage of the Launcher that displayed information on hover or click for the selected duration.
Segment Level Insights
This section displays the engagement metrics of the Launcher for the selected segment within the selected duration.

For example, you can see that the Finance Department includes 2 users engaged(hovered or clicked) with the Launchers 115 times and 4 users viewed the Launcher icons/buttons 208 times on the application for the selected duration.