
To view the Checklist Analytics dashboard:
-
Login to your Admin Portal.
-
Select your Application from the left panel and then click Content Analytics.

Note:
The Content Analytics section will be accessible to users only if all the following conditions are met:
-
The feature flag is enabled in your Admin Portal. To learn more, see List of Apty Feature Flags.
-
Segments for your Apty Content are created and in active state. To learn more, see What is a Segment and how is it helpful?
-
Users are identified using either the Application ID or the Custom ID. To learn more, see Unique User Identification (Version 4.x and above).
-
See Overview of the Content Analytics Dashboard for a comprehensive understanding of the global dashboard.
-
- Click the Checklist tab in the Content Overview section of the global dashboard.
- Once you navigate to the Checklist dashboard, you can use the following options to filter the data you want to display in the dashboard:
-
Duration- Displays the Checklist available for the selected period.
-
Environment- Displays the Checklist available for the selected Environment.
-
Segments- Displays the Checklist available for the selected Segments.

Info:
You can click the vertical ellipsis and then select Customize Dashboard to drag and drop a section to change the look and feel of the dashboard.
Dashboard Level Insights
At the dashboard level, users can obtain a comprehensive overview of metrics linked to selected Checklist content.

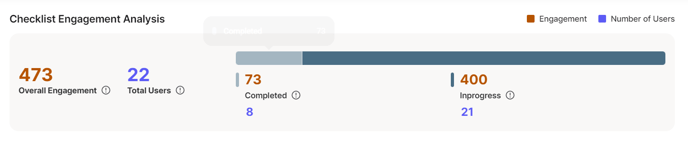
Checklist Engagement Analysis
This section illustrates the collective interaction users have had with the chosen Checklist on your application, along with the user engagement rate shift between the prior and the current selected period.
|
Data Type |
Status |
|---|---|
|
Overall Engagement |
|
|
Total Users |
|
|
In Progress |
|
|
Completed |
|
Checklist Engagement
This section consists of the top three Most Engaged, Least Engaged and Unengaged Checklists for the selected duration.

|
Data Type |
Status |
|---|---|
|
Most Engaged Checklist |
|
|
Least Engaged Checklist |
|
|
Unengaged Checklist |
Three Checklists with no engagement. |
You can hover your cursor over the i icons to view the description for each type.
Note:
You can click the View All button to view all the Checklists and their statuses.
Content Overview

This section presents the frequency of engagement with the Checklists deduced from their mean engagement rate for the selected duration. Assume that your application has five distinct Checklists and that the count of engagements with each Checklist for a certain month is as follows:
|
Checklists |
No. of times the Checklists were engaged within a month |
Mean (sum of engagements for the given duration/total no. of engaged Checklists) |
|---|---|---|
|
Checklist 1 |
100 |
(100+150+60+50)/4=360/4=90
|
|
Checklist 2 |
150 |
|
|
Checklist 3 |
60 |
|
|
Checklist 4 |
50 |
Consequently, the Checklists that have the Engagement count higher than the Mean are considered to be the Most Frequently Engaged, while the Checklists with the Engagement count lower than or equal to the Mean are considered to be the Least Frequently Engaged. Thus, the engagement order for the Checklists is as follows, starting from the Most Frequently Engaged to the Least Frequently Engaged:
Checklist 2 > Checklist 1 > 90 > Checklist 3 > Checklist 4.
You can hover your cursor over the i icons to view the description for each type.
Segment Level Insights
This section displays the metrics of all your Checklist engagements for the selected segment within the specified duration.

You can choose between Role and Department groups, then view the segments along with their engagement data displayed in popup balloons upon hovering over the bars.
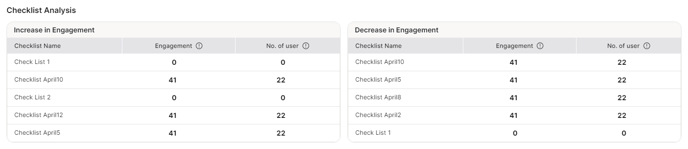
Checklist Analysis
This section lists the top 5 Checklists in the increasing and decreasing order of user engagement rate for the selected duration. Each filter also displays the number of users engaged with each Checklist.
Content Level Dashboard
For a more detailed analysis of individual Checklists, users can access specific insights directly through the Content Level dashboard.
a. Click the View All button on the Checklist Engagement section in the primary dashboard.

The following data is shown in a maximized table for all the existing Checklists created within your application:
|
Data type |
Display Status |
|---|---|
|
Checklist name |
Title of the checklist provided by the content creator. |
|
Engagement |
The total count of the checklist(s) that were initiated within the selected duration. |
|
No. of Users |
The total count of unique users who engaged with the checklist within the selected duration. |
|
Completed |
The total number of checklist(s) with all tasks completed during the filtered time period. |
|
Average Completion Rate |
The daily average of the users who engaged with checklist(s) during the filtered time period. |
|
Status |
The latest publishing status of the checklist. |
b. Select an Checklist from the table to examine its usage in detail.

Checklist Engagement Analysis
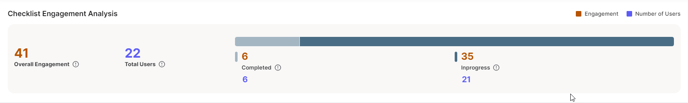
The table below provides the definitions for each Checklist status:
|
Data type |
Display Status |
|---|---|
|
Engagement |
The total count of the checklist(s) that were initiated within the selected duration. |
|
Total Users |
The total count of unique users who engaged with the checklist within the selected duration. |
|
Completed |
The total number of checklist(s) with all tasks completed during the filtered time period. |
|
Inprogress |
The total number of checklist(s) that are not yet completed during the filtered time period. |
You can hover your cursor over the i icons to view the description for each status.
Average Engagement Metrics

|
Duration |
No. of times the Checklist was engaged |
Daily Average Engagement count |
|---|---|---|
|
Day 1 |
100 |
(100+200+300+90+80+50+40)/7 = 122 |
|
Day 2 |
200 |
|
|
Day 3 |
300 |
|
|
Day 4 |
90 |
|
|
Day 5 |
80 |
|
|
Day 6 |
50 |
|
|
Day 7 |
40 |
Similarly, you can observe the daily average count of users who engaged with the Checklist, along with the daily average percentage of the Checklist that displayed information on hover for the selected duration.
|
Data type |
Display Status |
|---|---|
|
Frequency of Data |
The daily average of the checklist(s) engagements count during the filtered time period |
|
Avg. Users Engaged |
The daily average of the users who engaged with checklist(s) during the filtered time period |
|
Avg. Completion Rate |
The daily average of the users who engaged with checklist(s) during the filtered time period |
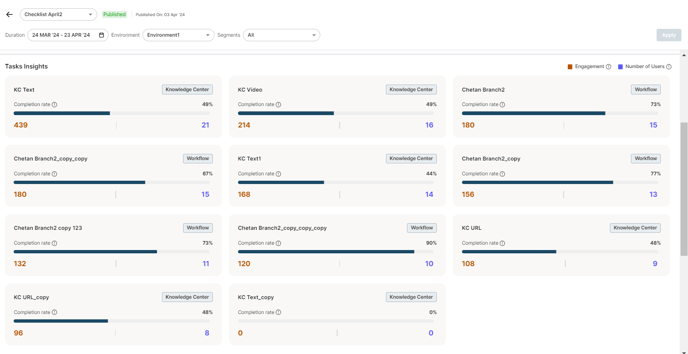
Tasks Insights
Gain task insights with checklist analytics, viewing engagement data for each task individually. Track completion rates, and user interactions to improve productivity and performance.
Segment Level Insights
This section displays the engagement metrics of the Checklist for the selected segment within the selected duration.

You can choose between Role and Department segment groups, and view the segments along with their engagements displayed in popup balloons.